The house tracker
We bought a house in Portland. Before that we spent a few weeks comparing about ninety of them, and the listing sites are bad at that: every house lives in its own tab, the floor plan is photo 34 of 40, and nothing tells you which of two houses has the bigger kitchen. So I built a tracker. It’s private (it holds our notes, our agent’s emails, and our finances), so there’s no link, but the screenshots are below.
How it started
The first version was a static HTML table, built on September 26 from a Redfin favorites export and a scan of Caity’s handwritten notebook from the houses we’d already seen. An hour later it was a login-gated app: React on a Cloudflare Worker, D1 for everything we typed into it, and Cloudflare Access so only the two of us (and later a couple of view-only logins) could see it.
Then it ate the internet. Each house pulls listing data from Zillow, Redfin, Compass, and Homes.com through MCP servers that ride my own logged-in browser, plus FCC broadband data, Portland and Vancouver crime data, permit history from each city’s portal, neighborhood shapes from the city open data portals, and walkable places from OpenStreetMap. Adding a house is pasting a listing link from my phone and typing “Ingest.” Seller disclosures and other PDFs from our agent’s emails got read by Claude, and every finding links to the exact page it came from. (The demo question was “which house had the septic tank?” The answer was a page number, not a vibe.)
For about ten days a cron job checked all the prices at 8 AM and 6 PM, then committed and deployed the site itself. A price drop in the last week fills the card’s price cell with a giant green down arrow, because I asked for that specifically.
The board
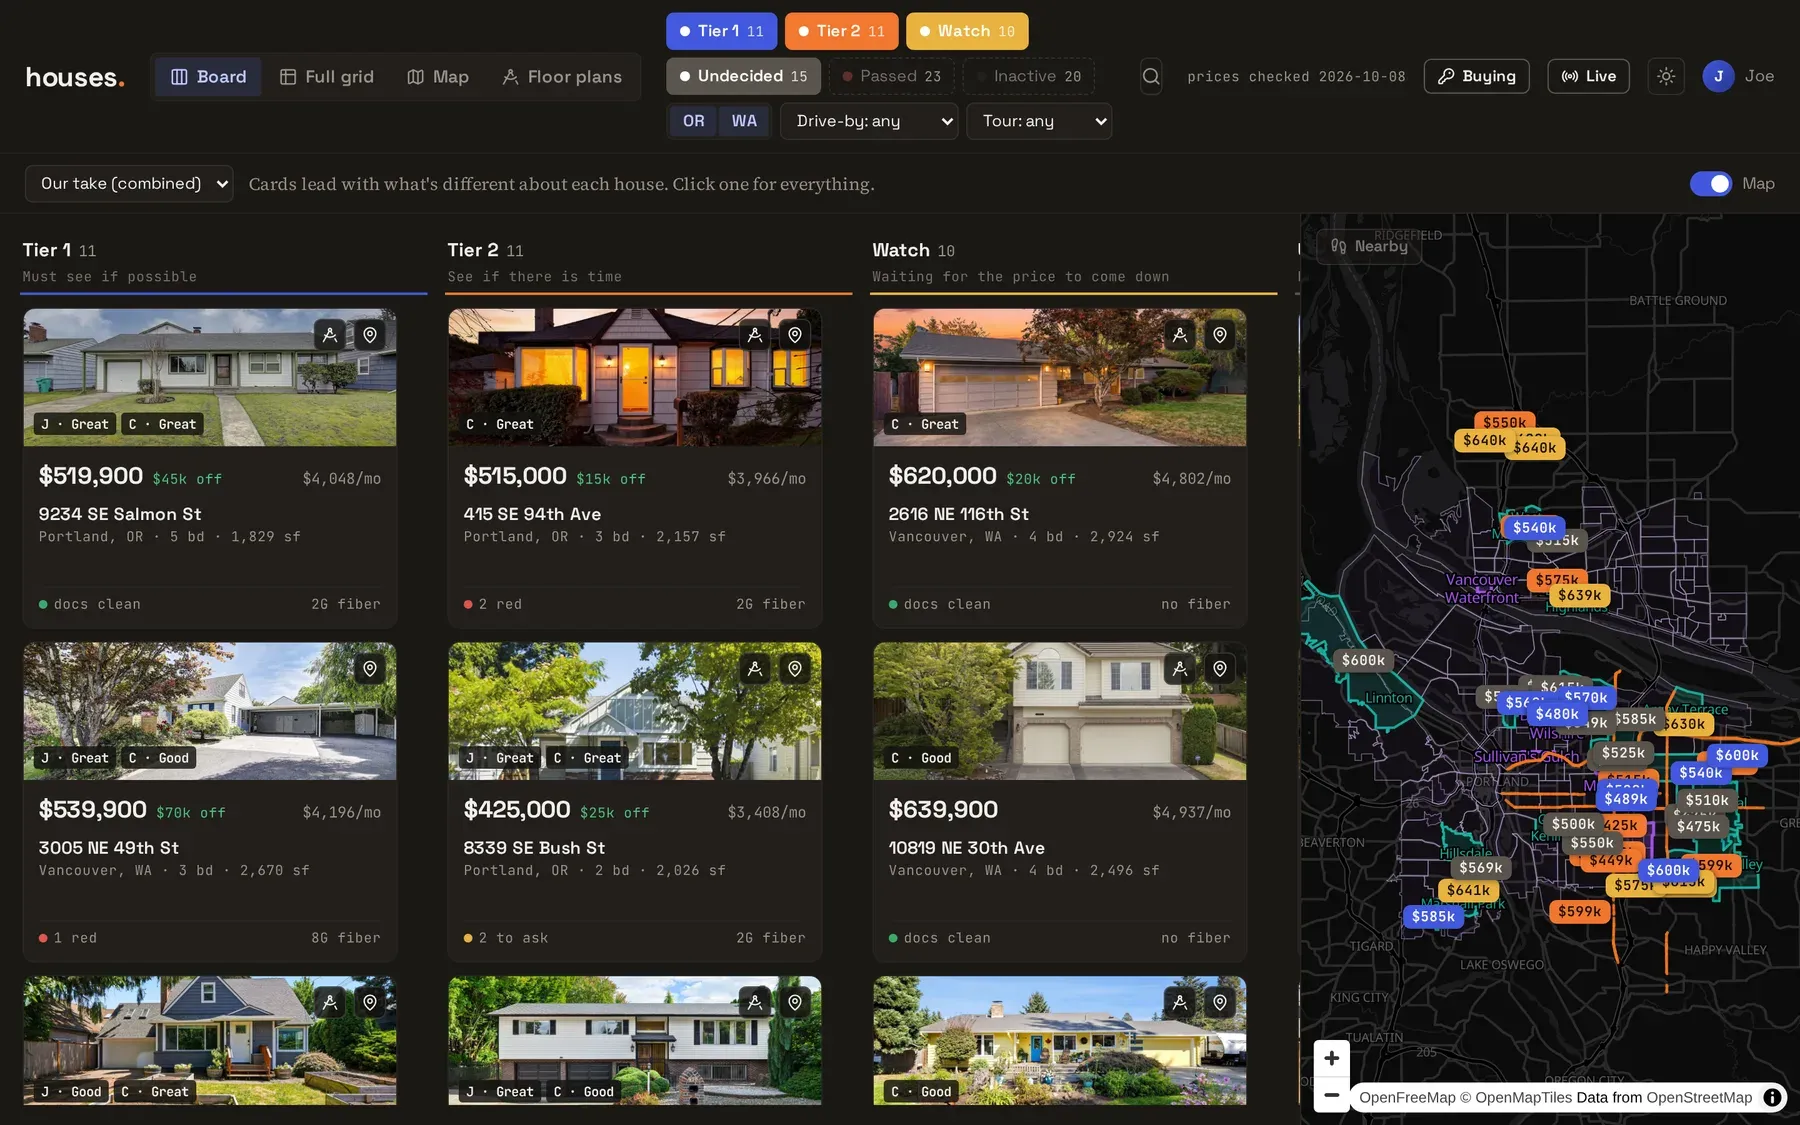
The first real UI was one giant horizontally scrolling table, which is a great way to see everything and a terrible way to notice anything. On October 2 my design agent handed back a redesign whose stated goal was “make it easier to find the important differences between houses,” and I told Claude Code to do all of it. Now houses sit in tier lanes, and each card leads with whatever makes it stand out against the rest (most space, weakest schools, fastest fiber, cleanest disclosures). The big comparison grid still exists, and the redesign took it from about two seconds to render down to 130 ms. I’d guessed the hover handlers were the problem. They were.
Nearby
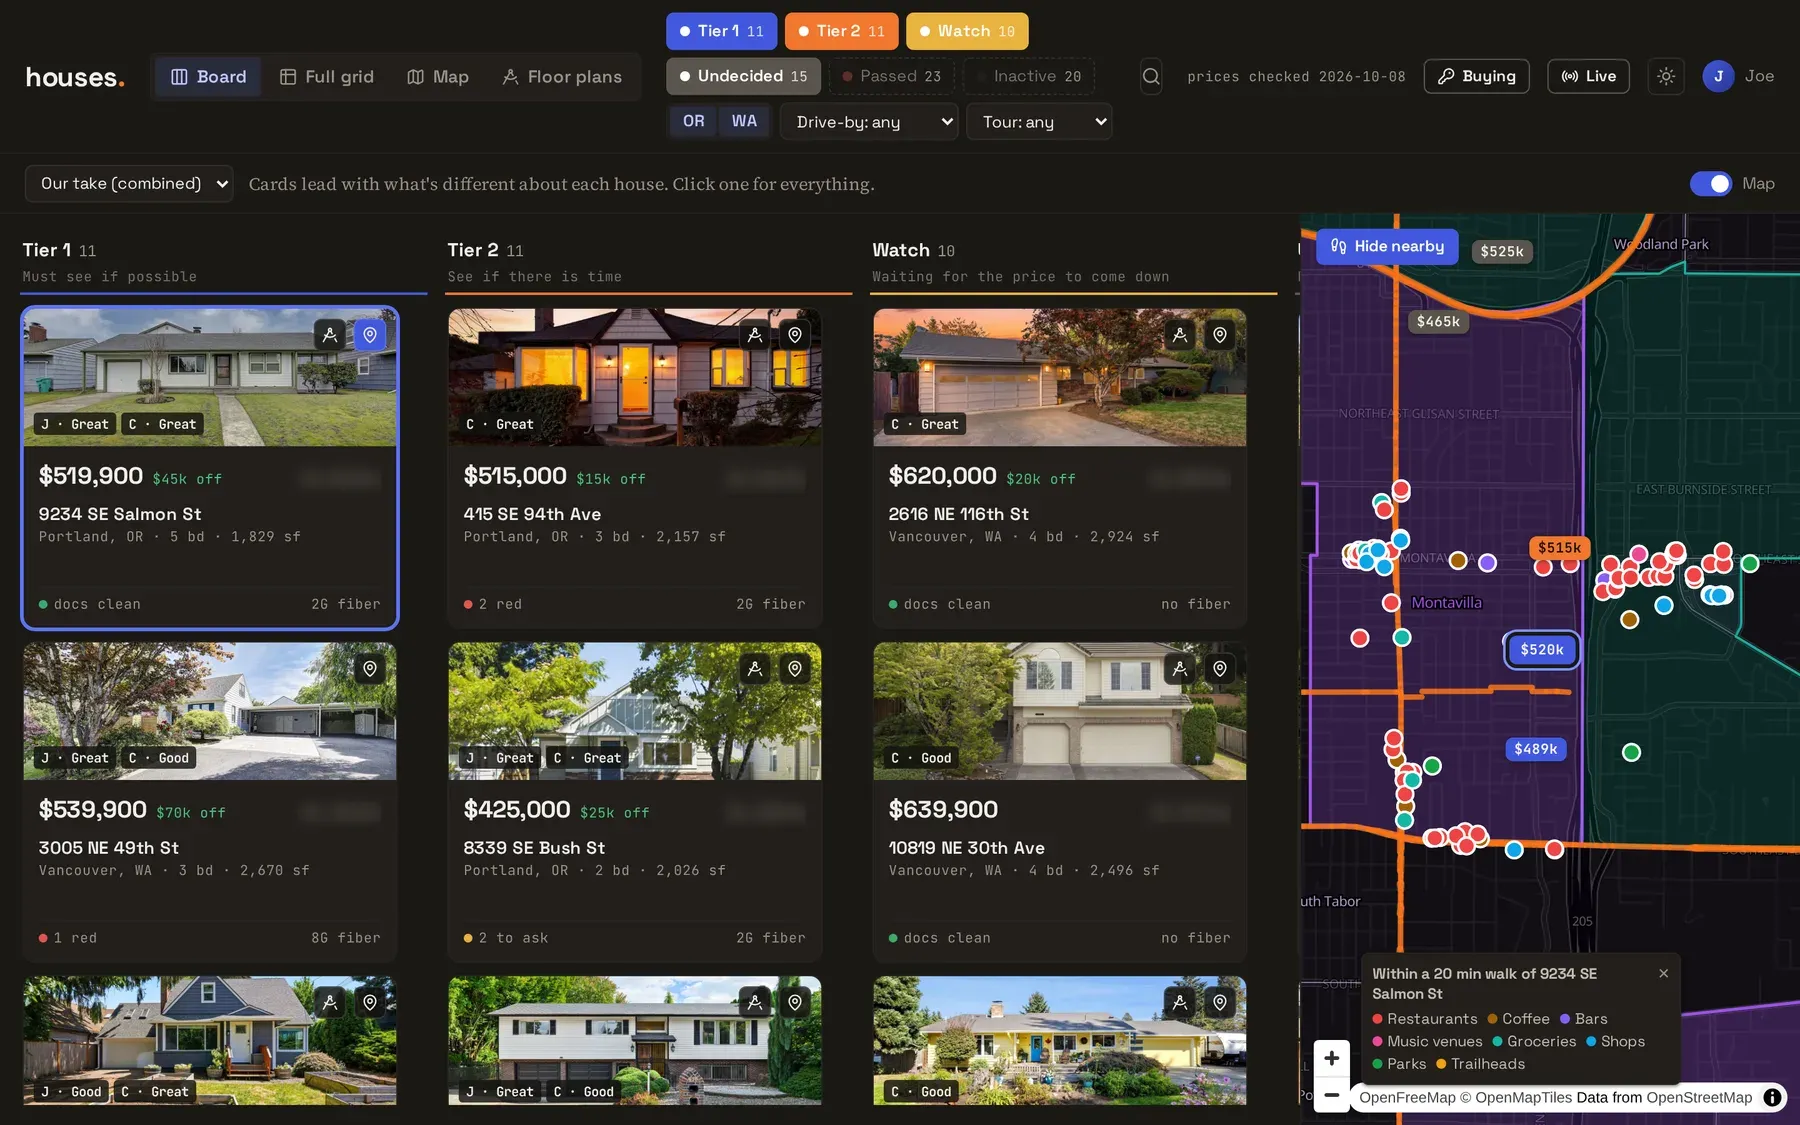
Each listing gets a list of what’s within about a 20 minute walk (restaurants, coffee, bars, music venues, groceries, parks, trailheads), and one button drops all of it onto the map.
Floor plans
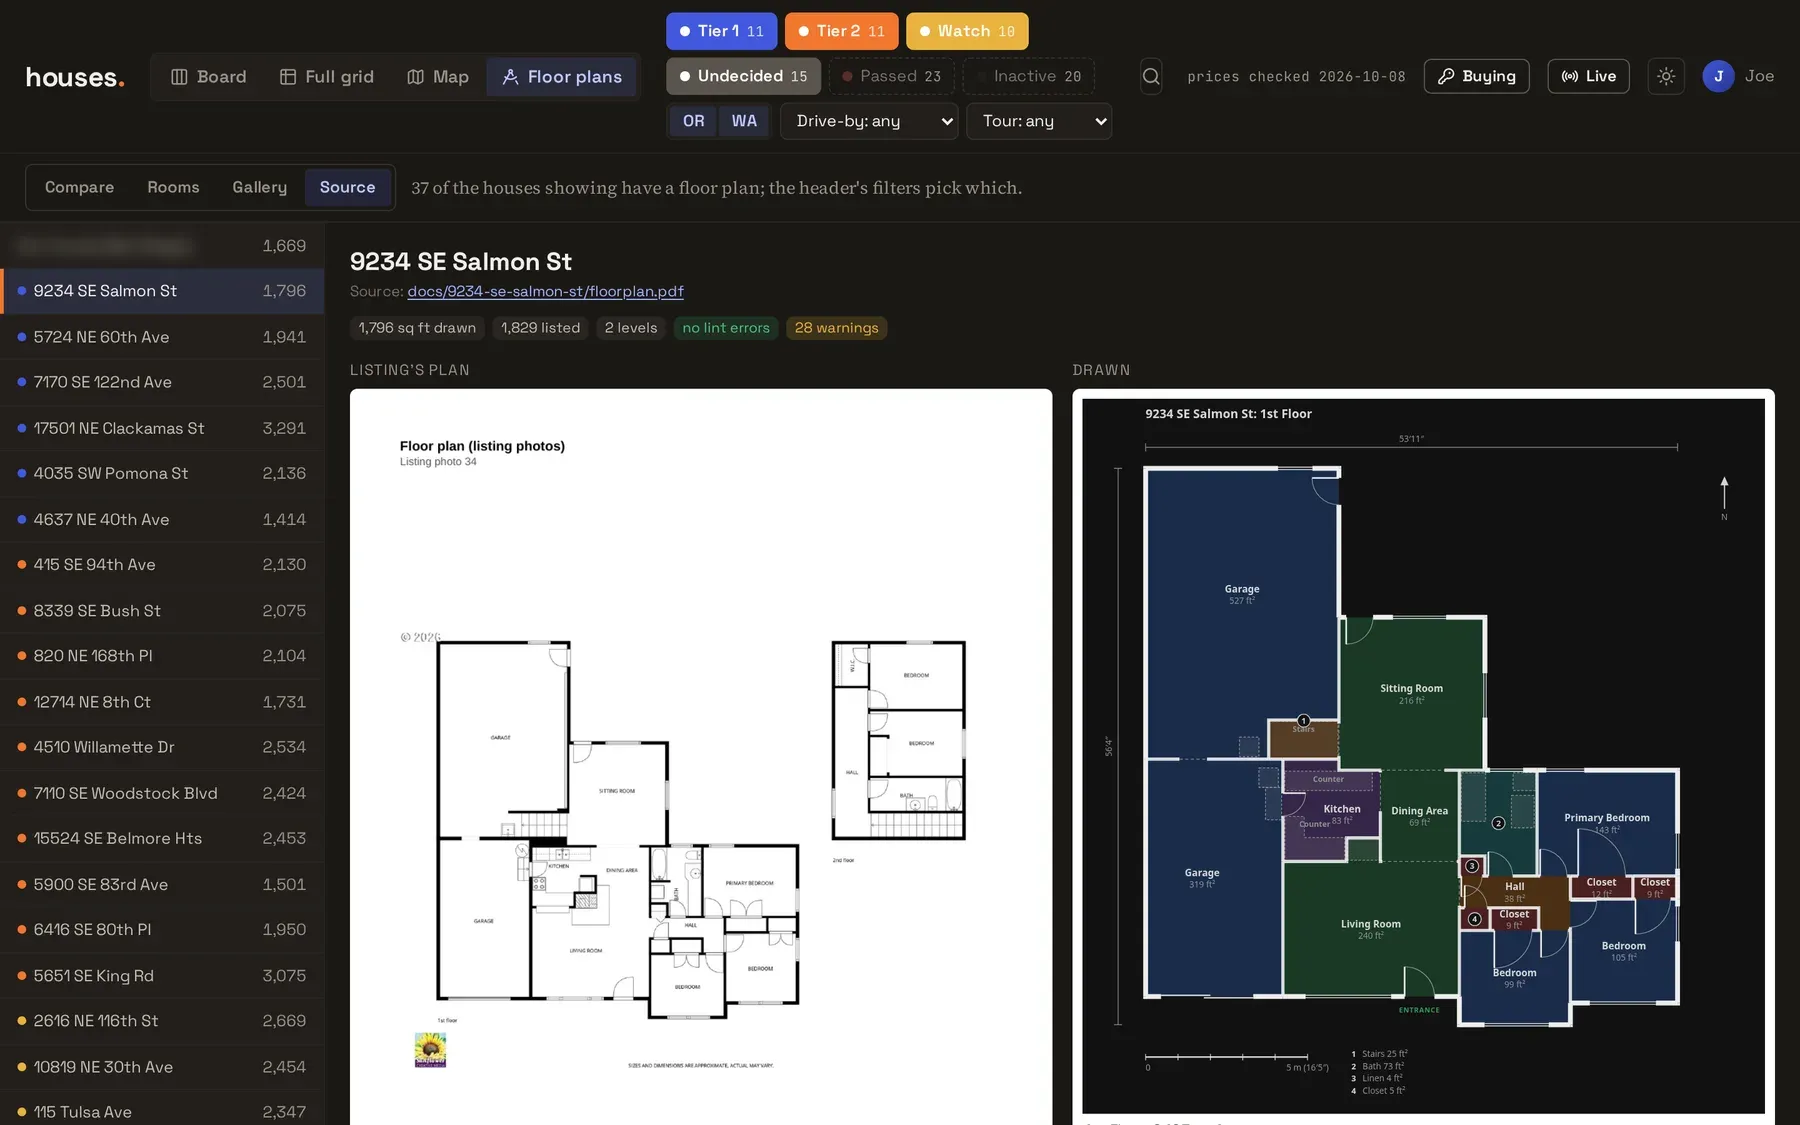
This one was a side quest that turned into the best part. I found floorplans, a library that renders floor plans from a small text DSL, and set up a pipeline where headless Claude (Opus 5.5 through claude -p) looks at a listing’s floor plan image, redraws it in the DSL, renders its own drawing, compares it to the original, and fixes it until they match. It logs the square footage it drew against what the listing claims. Sixty-four conversions, about $1.40 a house at API prices, which I was told and then immediately decided was perfect.
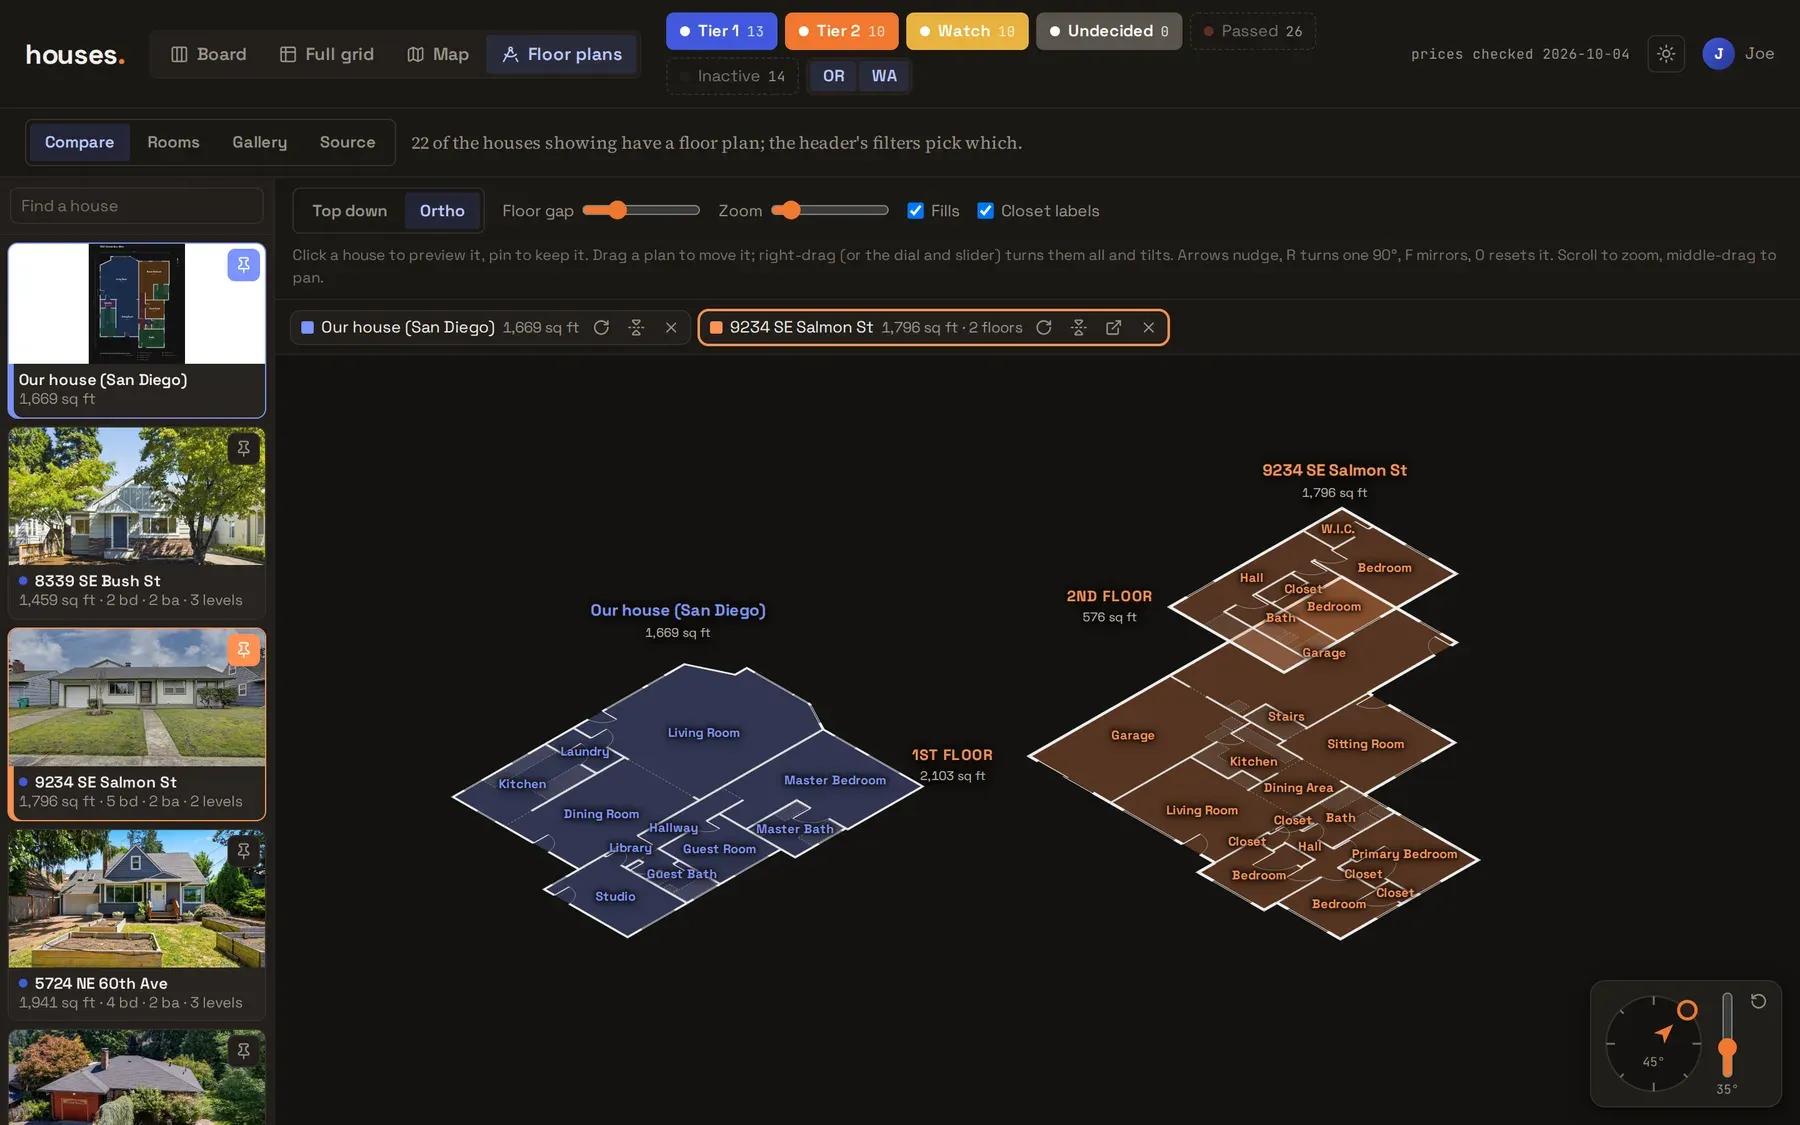
Once the plans are data, you can do things with it that the listing sites can’t. Compare stacks each house’s floors in an orthographic view you can orbit, always next to the house we were leaving:
And Rooms cuts one kind of room out of every plan and lines them up at the same scale, biggest first. This is the kitchen comparison:
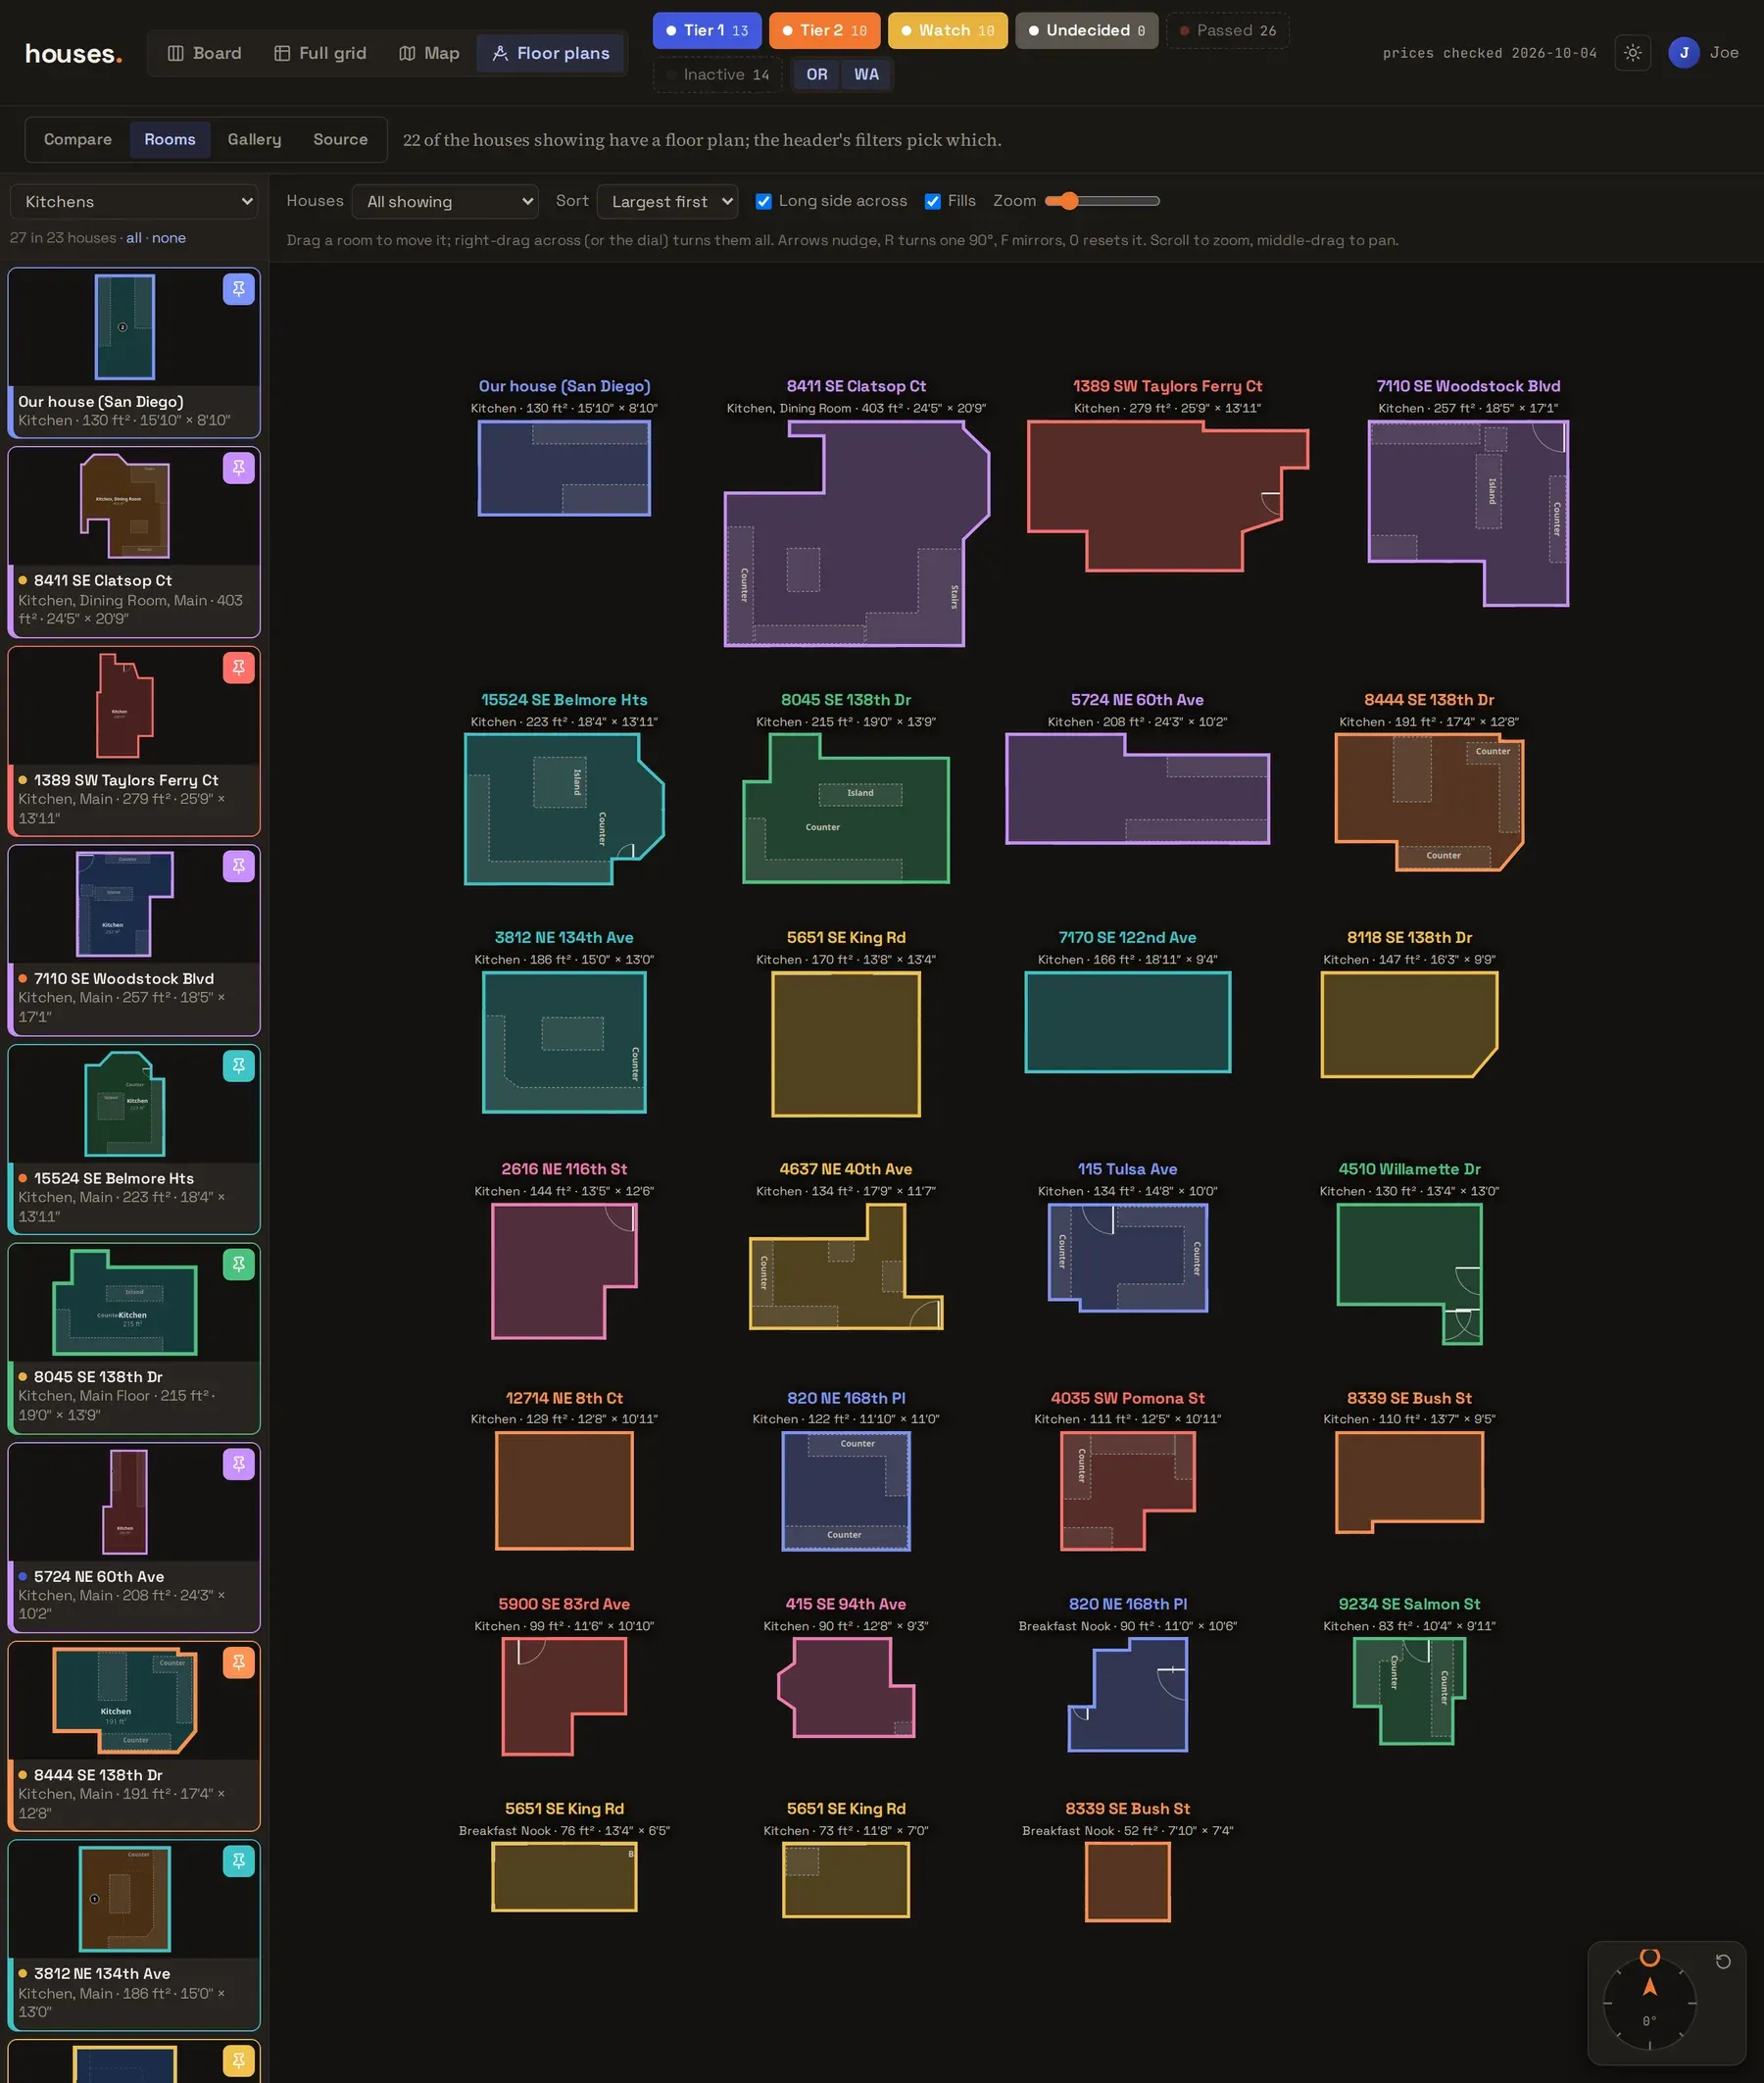
The library’s playground crashed on one of its own examples along the way, so I sent the author a fix and a bug report.
The trip
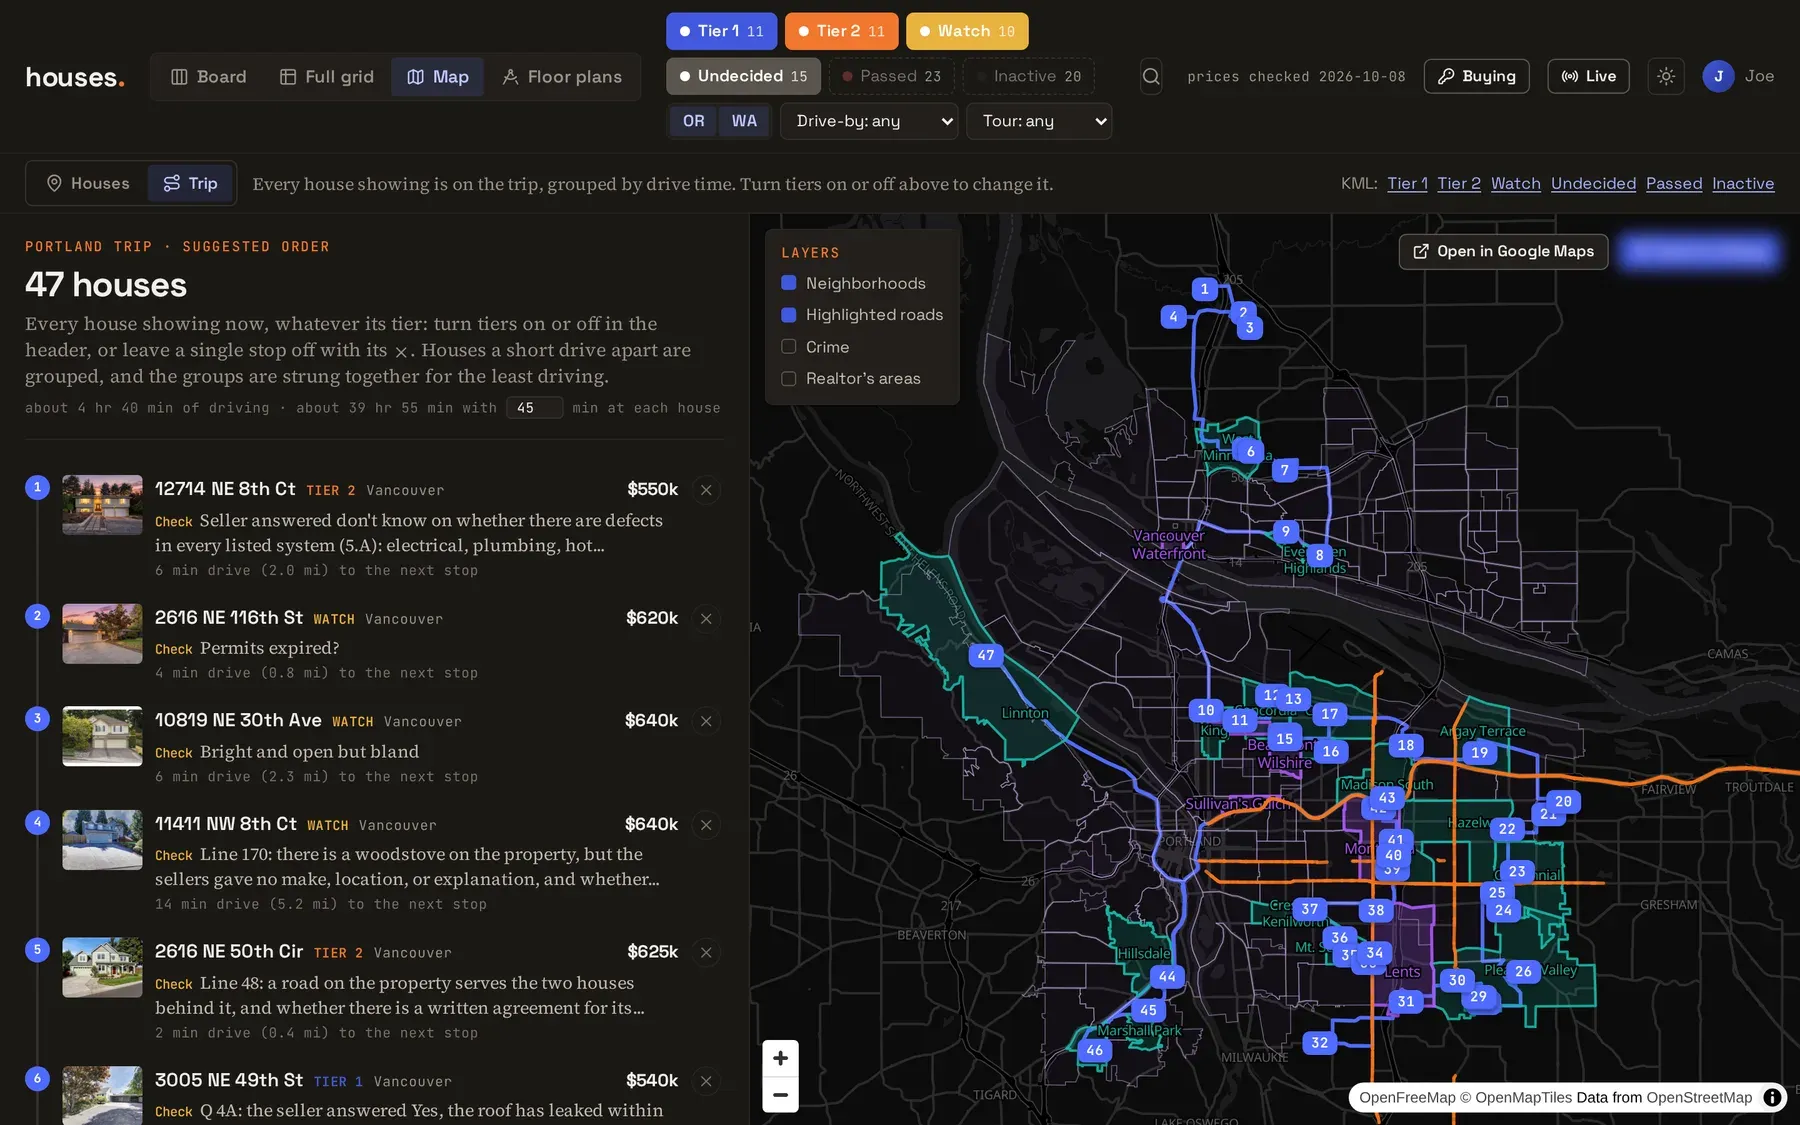
Then we went to Portland to see them in person. The trip planner clusters the whole list by drive time, orders the clusters, and solves the exact best order within each one using driving times from OSRM. It prints minutes per leg and an editable minutes-per-house, and a single button sends the itinerary to our agent.
The morning the trip started, I asked for a phone page for the car. A deploy mid-trip swapped the script bundles out from under the page I had open, which produced a message to Claude that just said “The entire site is down.” It wasn’t.
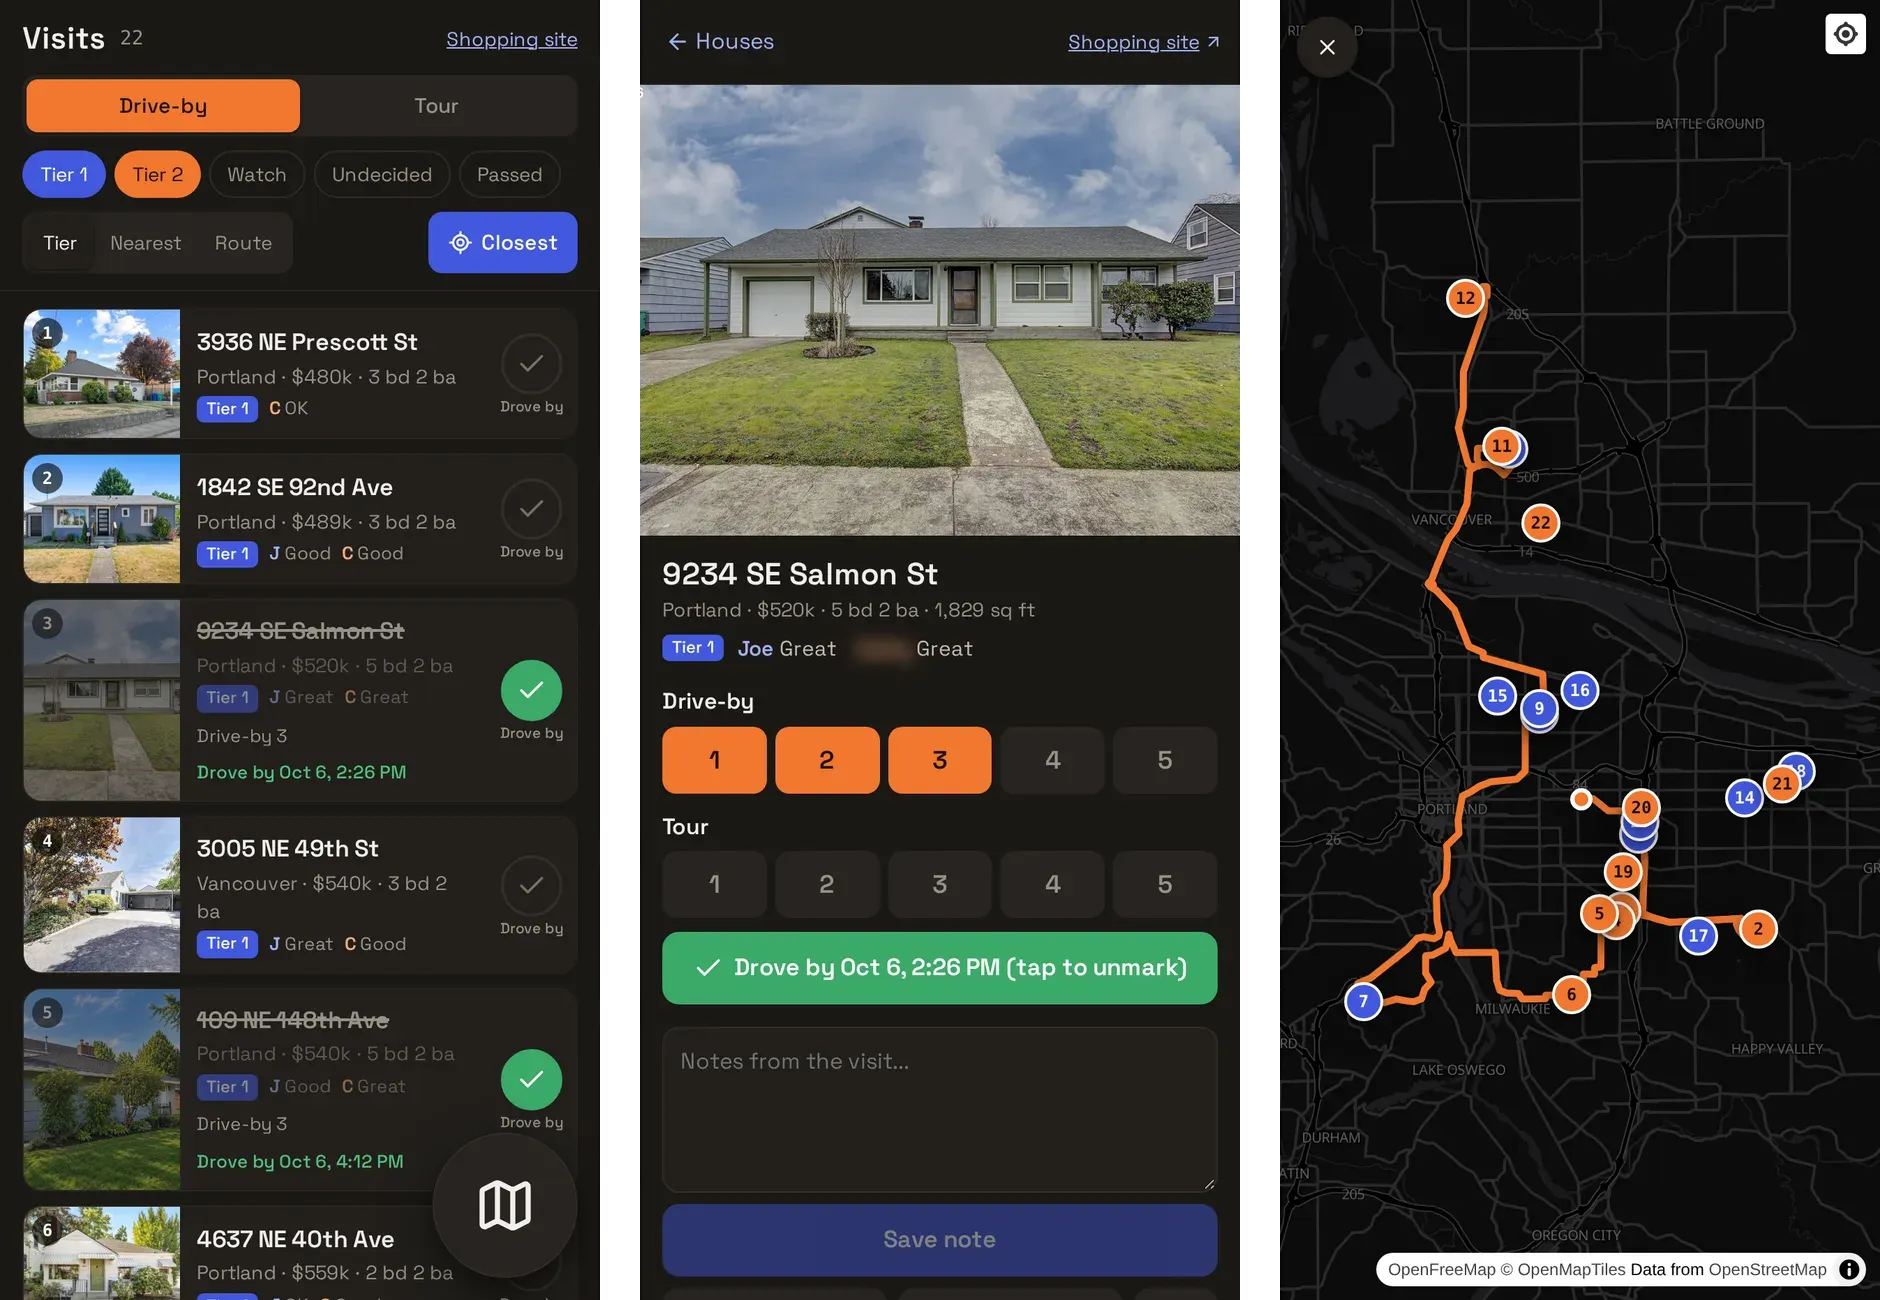
Each house gets “Drove by” and “Toured” buttons, a 1 to 5 score for each, notes, and a camera upload for photos and video. The list can sort by nearest (from the phone’s location) or plan the shortest route through whatever’s left.
Drive-by ratings
That night I wanted to filter by the drive-by scores, so now the header has a drive-by filter and a tour filter.
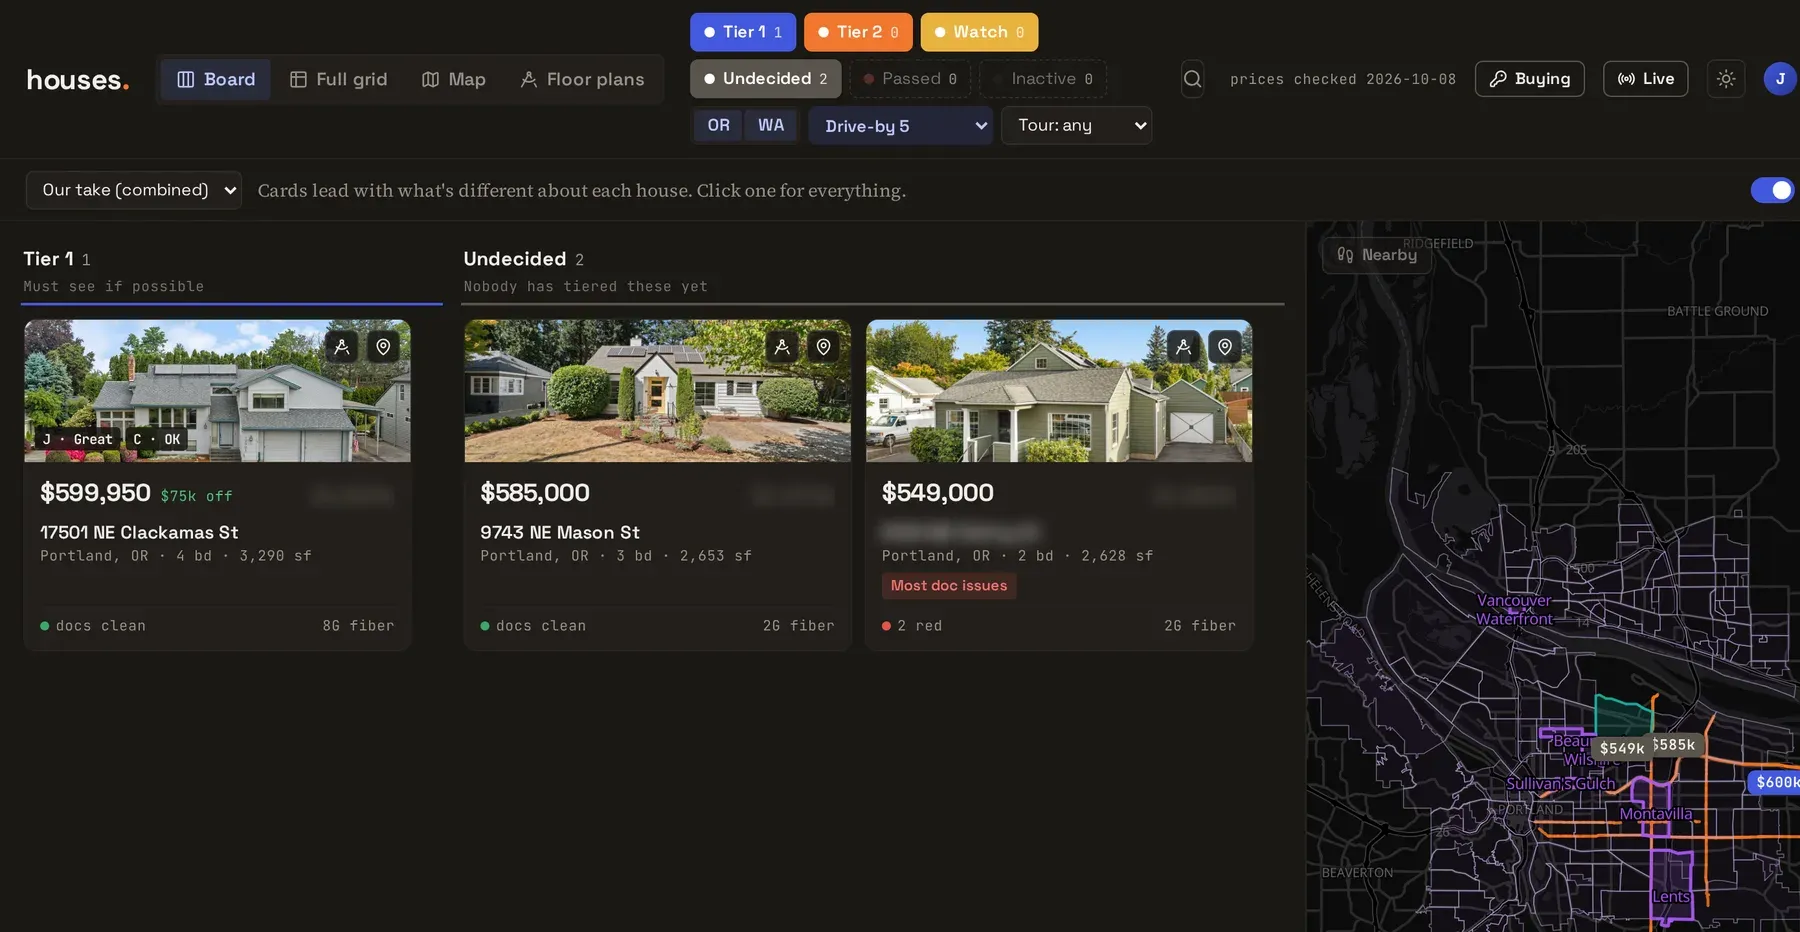
I scored 18 houses from the car. Three got a 5. The blurred one is the house we bought.
After the offer
On October 7 we were down to four. On October 8 I told Claude we were putting in an offer and to mark everything else as passed, and it said “Good luck!” The shopping app moved to a subfolder, and the root of the site became a buying tracker: contract deadlines counted in business days (skipping Oregon and federal holidays), inspection, sewer scope and radon results, lender quotes, contractor bids, and a read-only Gmail hookup that checks hourly for mail from the agent, the lender, and the title company. I’m not showing that part, for reasons that I hope are obvious.
All told: 200 commits from September 26 to October 21, and zero tests.
The promo video
Somewhere in the middle I had Claude make a 42 second promo video for it, built in Remotion from real screenshots. It was made for an audience of one (my wife):
Is it a product?
A few people have asked me to turn it into one. I’m not convinced it can stand without someone to babysit it. The listing scrapers ride my own logged-in browser and stall when a captcha shows up, adding a house means pasting a link into a Claude Code session, and the disclosure reading happened in those same sessions with me watching. Take away the person at the keyboard and most of it stops.