Roadtripper
A road trip forecast app, built the night we left
We’re driving an RV from San Diego to Portland, 1,082 miles up I-5. An RV is tall, flat-sided, and not fond of crosswinds, so the thing I wanted to know was gusts: if we leave at 10 PM, what’s it doing at Weed when we get there at 9 the next morning? And what about the same spot if we leave at 4 AM?
Weather apps tell you what it’s doing in Weed. They don’t tell you what it’ll be doing in Weed at the hour you drive through it, for every town on the route at once.
I started by asking my OpenAI Dot to find me an app that shows forecast road conditions for an RV trip from San Diego to Portland. It found a couple, and they were basically terrible. After a bit of back and forth we had a planfile drafted, and I thought, eh, why the hell not.
So on Friday evening, with the RV mostly packed, I pointed Claude Code at it and typed this:
Read the md in this repo and make a badass webapp with the quickness. Use subagents to get it done faster
It’s live at trip.joemattie.com and the code is on GitHub.
What it does
You give it a start, a destination, and a departure time. It plays the drive forward on a map, with the vehicle moving along the route and the forecast moving underneath it on the same clock. A timeline along the bottom shows wind, gusts, rain, and temperature at each point for the minute you’d arrive there, with the rough stretches marked.
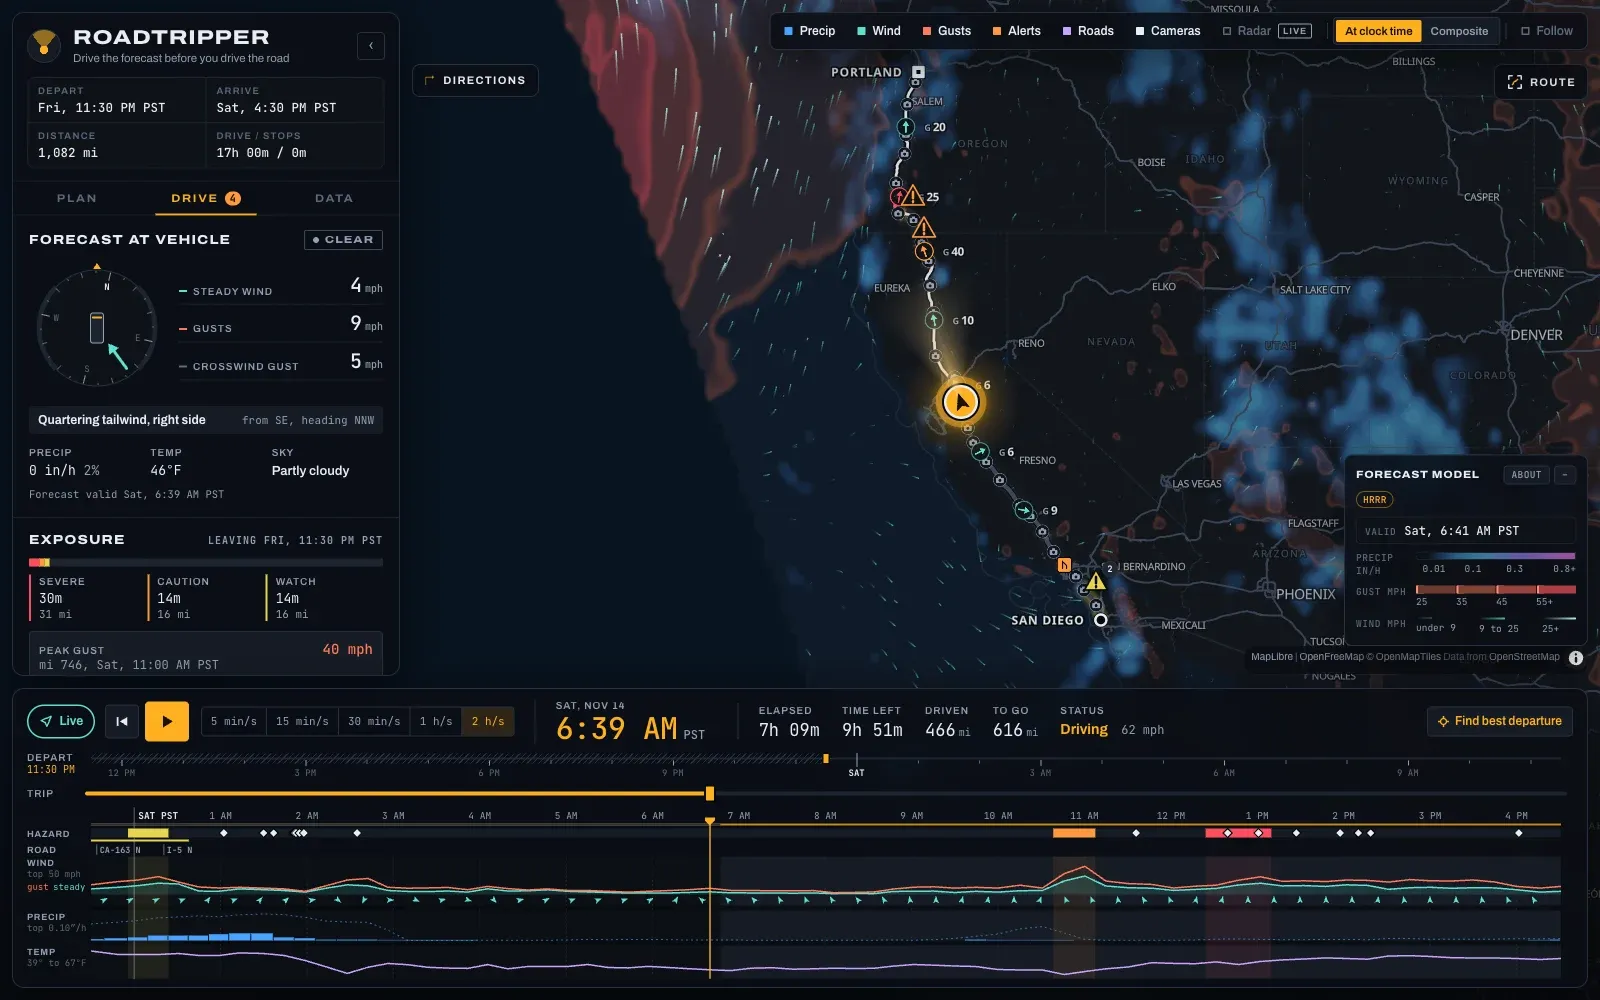
Drag the departure slider and the whole thing reshuffles. That was the original ask, and everything after it was me saying “one more thing.”
It works on a phone too, which matters, because the thing riding in the RV is an iPad.
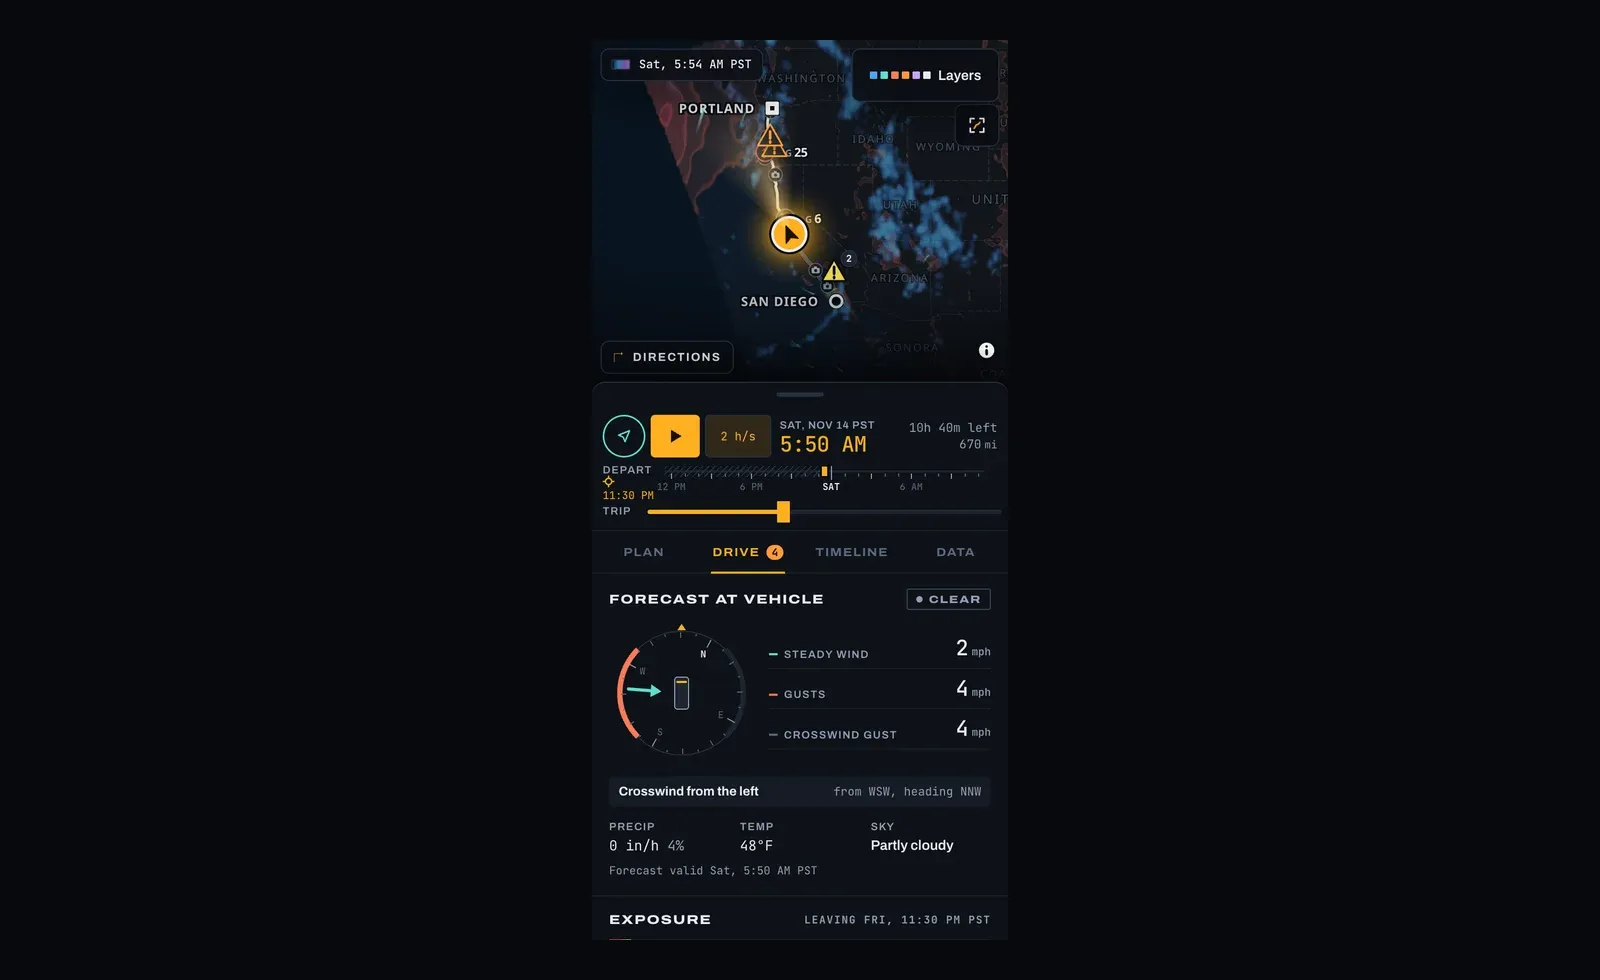
The first hour
Claude read the planfile, wrote a single file of shared types, and handed four agents a slice each: routing, weather, the map, and the panels. The types file was the contract, so nobody had to wait on anybody. It wired up the app shell itself while they worked.
Twenty-seven minutes after I hit enter there was a working app on screen, with the I-5 route and a forecast along it. The plan had an acceptance test (check the arrival time and gust numbers at Weed against the raw API for a 10 PM and an 11 PM departure), and it passed to two decimal places. I asked for a deploy, and it was on a Cloudflare Worker a little over an hour in.
I gave it a TomTom key partway through so the route would account for traffic. When I asked for the deploy, it moved the key behind a proxy on the Worker so it wouldn’t ship inside the page.
One thing that bit me: I ran wrangler secret put from inside the session, where it can’t prompt for the value, so it cheerfully saved an empty secret and reported success. Claude noticed and set it from a file.
Then I kept typing
Here’s roughly what the rest of the night looked like from my side:
Another ask: can you make this work on mobile?
Now I need a “Find best departure time” button (Optimize?) That brings up a modal letting you select what to avoid: High wind, Rain, Ice/snow, fog, steep climbs / descents at night, traffic
And is there the possibility of bringing in NOAA forecasts / weather radar as well?
Can you pull in caltrans and ODOT data as well?
Can we add a map layer that shows icons along the route linking to live traffic images (like on caltrans and tripcheck) that open in a modal?
Make the vehicle marker follow my actual GPS position
Oh one last thing
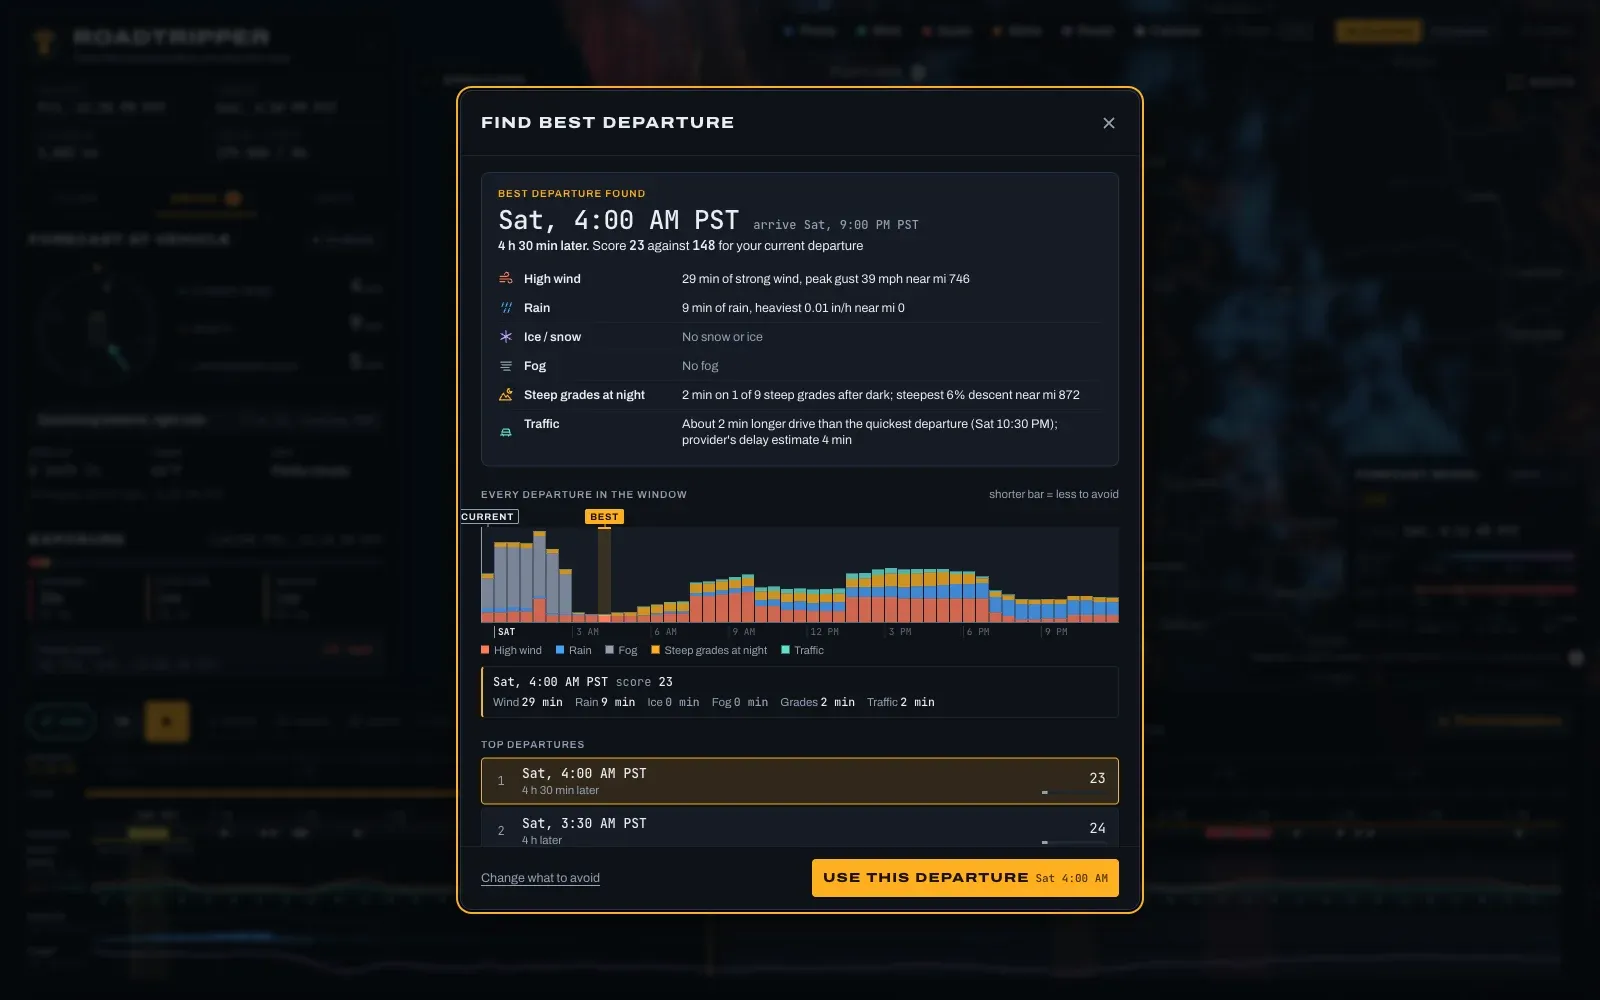
All of those are in it now. “Find best departure” scores a departure every half hour across whatever window you give it. The night-grades option needed an elevation profile of the route, so an agent pulled terrain tiles, found the steep stretches on I-5 (Grapevine, Siskiyou Summit, Sexton Mountain, and a few more), and worked out which ones we’d hit in the dark for each departure.
When I ran it with everything checked, it said to leave Saturday at 4:00 AM: a score of 23 against 192 for Friday at 10 PM. About an hour later we decided we weren’t going to be ready before 3:30 anyway.
Running out of weather
The forecast came from Open-Meteo, which is free up to 10,000 requests a day per IP address. A fresh route costs about 350 of those, because every point on the map layer counts. Six Claudes spent the evening reloading the app to test it, and by 9:35 PM my home network was cut off until 4 PM the next day.
Getting cut off pushed the weather onto better sources. First the route forecast moved to the National Weather Service, which is free, keyless, and adjusted by human forecasters. Then I asked whether the map layer could come straight from NOAA’s model files, which are in a binary format called GRIB2 that browsers don’t read. An agent wrote a decoder for it in TypeScript and checked it against the reference library on a million-point file. (Two agents wrote one each, because a message crossed in the mail. Both were right.)
The model that’s easy to get that way is GFS, and it’s too coarse for mountains. At Weed on Saturday at noon it showed gusts of 14 mph. The weather service forecast for the same place and hour said 35.
The model that gets it right is HRRR, at 3 km and hourly, and its files are a hundred times bigger. I mentioned I had a Modal account. Within half an hour there was a small Python service on it that pulls each new HRRR run from NOAA’s public bucket and serves just the area you’re looking at. Its first night cost two cents.
Roads and cameras
Caltrans publishes lane closures, chain controls, message signs, and roadside weather stations as open feeds, and Oregon’s DOT has an API with a free key. Both are matched to the route now. Scheduled work gets checked against when you’d pass it, so the overnight closures through Los Angeles only show up if you’re going to be there overnight.
The Caltrans files are huge and uncompressed (24 MB for our route). Sending them through the Worker gets that down to about half a megabyte.
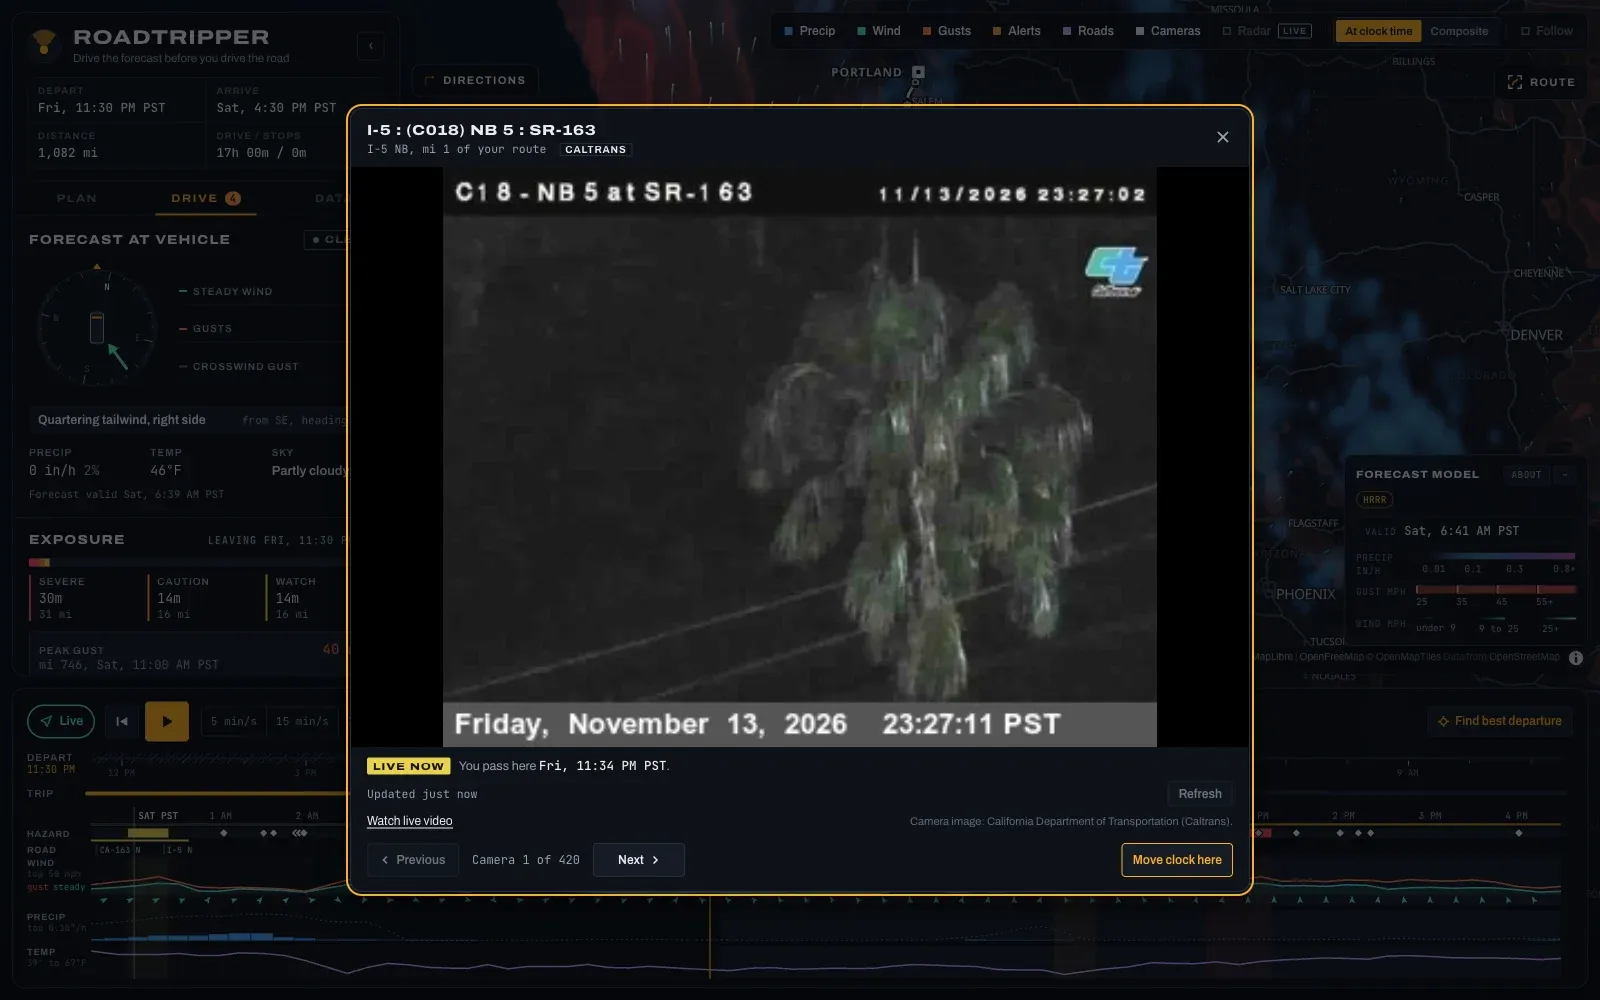
There are also 420 traffic cameras on the route between the two states. Tap one and you get the live picture. At 11:27 PM in San Diego, the live picture is a palm tree.
Claudespeak
Left alone, an agent labels everything like a lawyer is watching. The map legend said “approximation · not radar.” The camera view said “Not a forecast of your arrival.” Road reports ended with “May change before you arrive.”
I asked for all of that to go. The legend now says “HRRR.”
Numbers
From the first prompt to the last deploy was about three and a half hours on a Friday night. That got 27,900 lines of app code, 9,600 lines of tests and fixtures, and 282 tests, from five agents plus the one coordinating them. I didn’t write any of it.
It only knows California and Oregon for road conditions and cameras, because that’s where we’re driving. The forecasts work anywhere in the US. If you want it for your own trip, fork it. The README says where a new state plugs in.
The GPS mode was only tested with fake positions. The drive is the test.
We’re leaving at 4 AM. If we never make it to Portland because of some extreme weather event, this post will be a darkly hilarious testament to AI psychosis.